← Back to Dashboard
MIRSA Diagnostics
API Response Times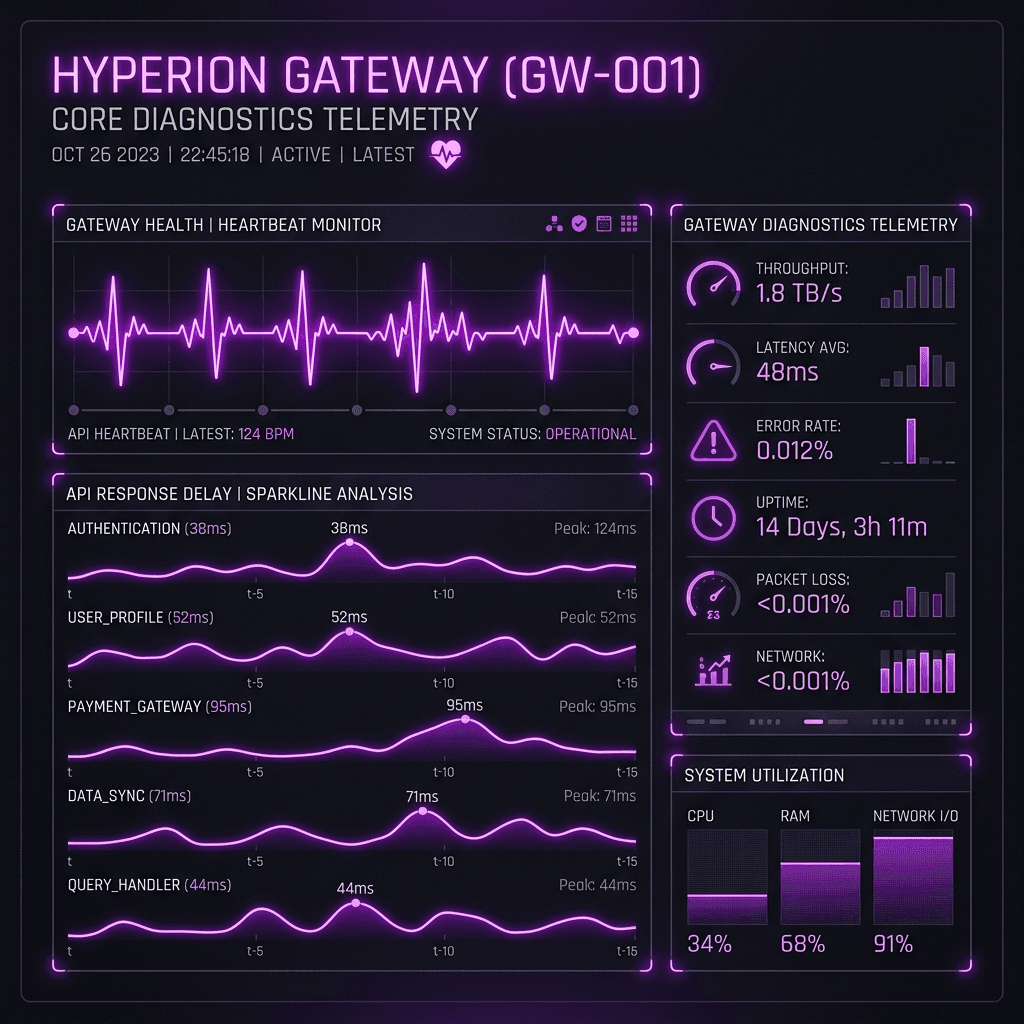
API Gateway Latency Distribution
Response time profiling and rate metrics across high-throughput endpoints.
Percentage Resource Allocation Breakdown
Fast Responses (<20ms)SYS-1
68%
Cached DB operations and static assets
Normal Responses (20-100ms)SYS-2
22%
Write operations and transaction logic
Slow Responses (100-250ms)SYS-3
8%
Complex report queries and payment integrations
Network Timeout ExceptionsSYS-4
2%
Safe failsafe rate-limiting blockades
Overall System Health Status
Resource scheduling validation matches optimal performance profiles. Active thread pools executing without lock bottlenecks.
AGGREGATE LOAD100% OK